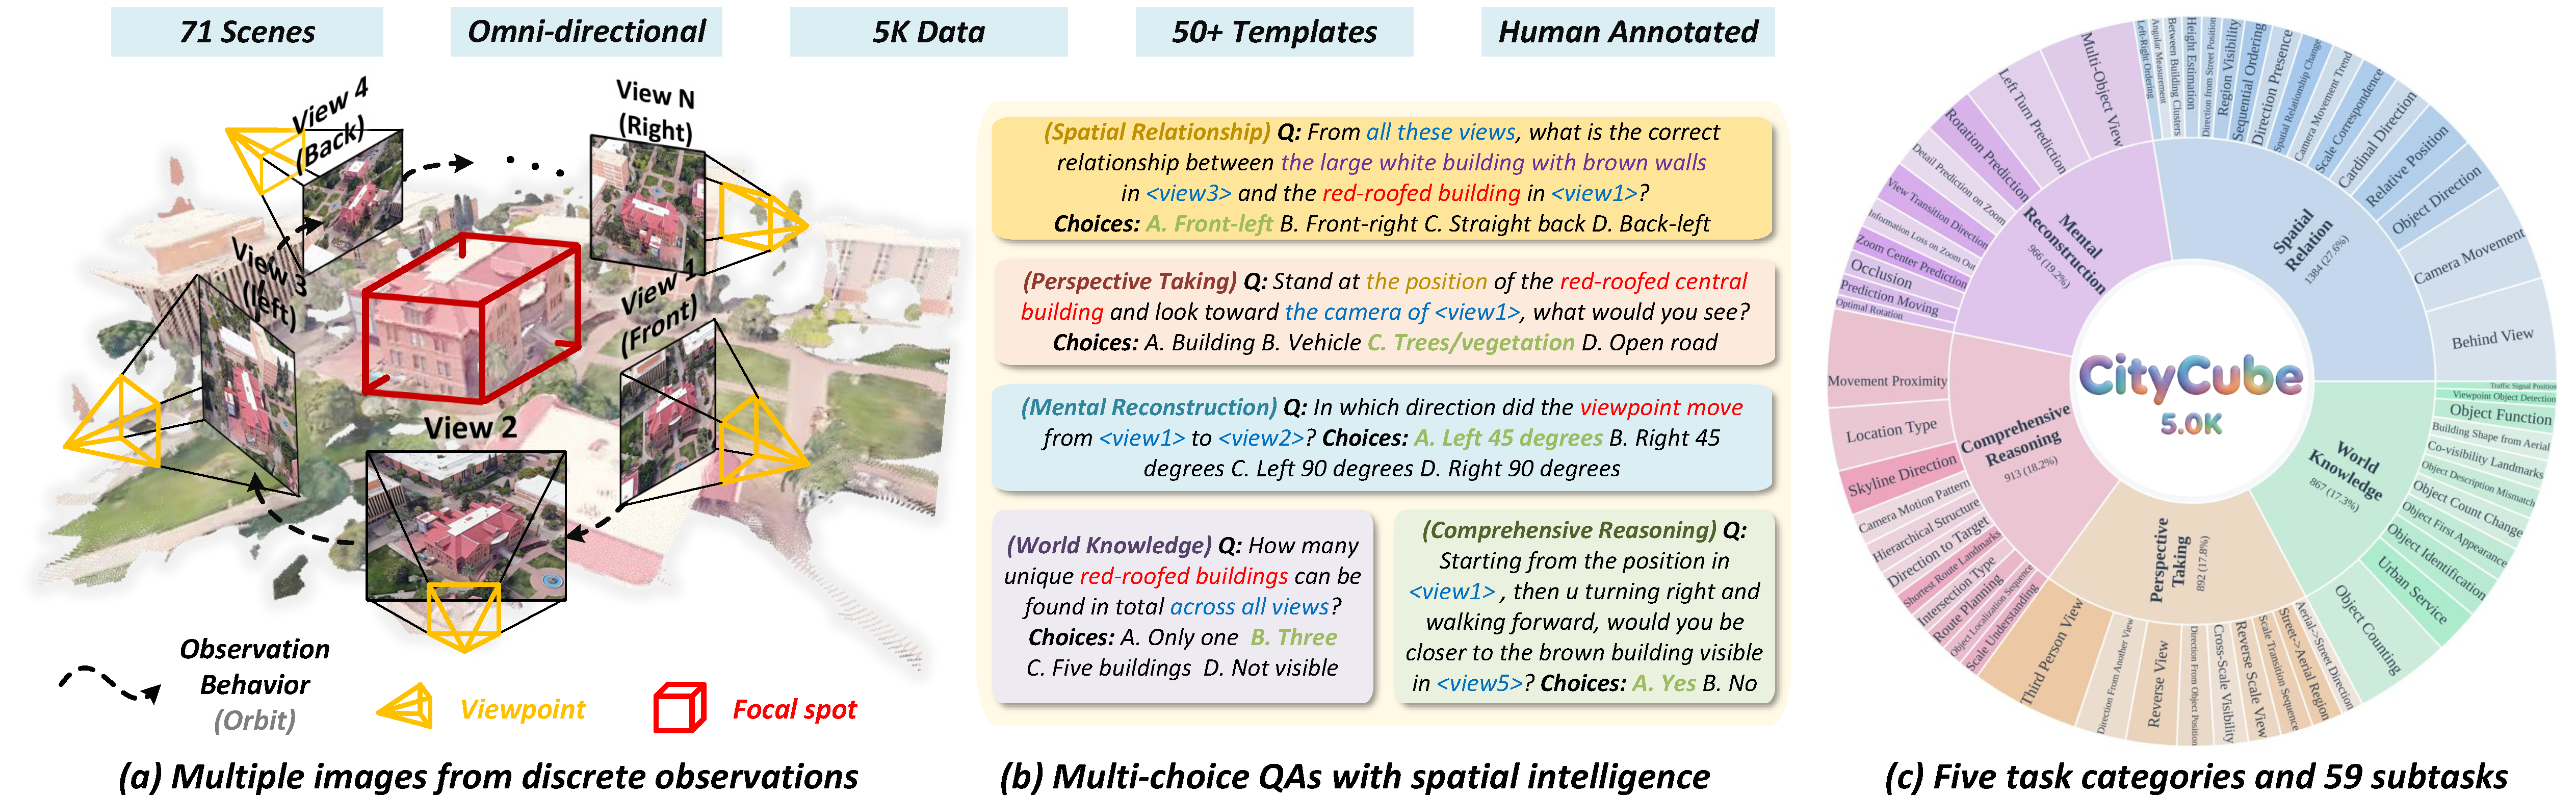
CityCube

Benchmarking Cross-view Spatial Reasoning on Vision-Language Models in Urban Environments

Haotian Xu1,2 Yue Hu1,2 Zhengqiu Zhu1,2 Chen Gao3 Ziyou Wang4 Junreng Rao1,2 Wenhao Lu1,2 Weishi Li1,2 Quanjun Yin1,2 Yong Li4

1 College of Systems Engineering, National University of Defense Technology

2 State Key Laboratory of Digital Intelligent Modeling and Simulation

3 BNRist, Tsinghua University

4 Department of Electronic Engineering, Tsinghua University

Under Review

Abstract

Cross-view spatial reasoning is essential for embodied AI, underpinning spatial understanding, mental simulation, and planning in complex environments. Existing benchmarks primarily emphasize indoor or street settings, overlooking the unique challenges of open-ended urban spaces characterized by rich semantics, complex geometries, and view variations. To address this, we introduce CityCube, a systematic benchmark designed to probe cross-view reasoning capabilities of current VLMs in urban settings. CityCube integrates four viewpoint dynamics to mimic camera movements and spans a wide spectrum of perspectives from multiple platforms (e.g., vehicles, drones, satellites). It features 5,022 meticulously annotated multi-view QA pairs categorized into five cognitive dimensions. Our evaluation of 33 VLMs reveals a significant performance disparity: even large-scale models struggle to exceed 54.1% accuracy, remaining 34.2% below human performance.

Project Overview

CityCube Overview

Figure 1: Illustration of the CityCube benchmark. Left: Embodied orbiting observation. Middle: Multi-choice QA examples. Right: Task distributions.

Benchmark Curation

Evaluation Taxonomy

CityCube evaluates VLMs across five fundamental spatial intelligence dimensions:

  • Spatial Relations (SR): Distance, direction, and topology.
  • Perspective Taking (PT): Object grounding across views.
  • Mental Reconstruction (MR): Spatial transformation simulation.
  • World Knowledge (WK): Urban commonsense and geometry.
  • Comprehensive Reasoning (CR): Multi-step inference (e.g., navigation).

Benchmark Taxonomy

Data Generation Pipeline

We collect 18.1K images from diverse real-world datasets (nuScenes, GeoText-1652) and high-fidelity simulators (MatrixCity, EmbodiedCity). The pipeline includes trajectory matching, image similarity filtering, and a rigorous human-AI collaborative QA generation process.

Data Generation Pipeline

Main Results

Accuracy of 33 VLMs on CityCube. Bold indicates best, underline indicates second best.

Method Rank Avg. World Knowledge Perspective Taking Spatial Relation Mental Recon. Comp. Reasoning
Overall
Urban Svc.
Obj Ident.
Obj Count
Overall
Another-view
3rd Person
Reverse
Overall
Obj Dir.
Rel Pos.
Cam Move
Overall
Multi-Obj
Rot Pred.
Left-turn
Overall
Route Plan
Target Dir
Loc Type
Baselines
Random -22.8 19.224.03.224.4 20.518.321.911.5 25.525.025.225.0 22.025.115.024.2 25.216.028.128.6
Human Level -88.3 78.685.084.073.2 87.493.094.296.5 90.279.284.986.4 92.484.289.496.8 93.1100.091.586.4
Proprietary Models
GPT-5.1 353.4 58.347.070.253.1 46.932.227.744.3 51.656.744.542.7 53.742.952.238.2 57.814.059.348.6
Gemini-2.5-Pro 253.8 57.955.057.547.0 50.933.941.351.3 50.960.839.530.1 52.041.443.443.4 59.324.049.255.7
Qwen-3-VL-Plus 545.2 40.842.063.837.8 44.647.041.752.2 46.560.035.331.8 37.144.245.137.1 56.718.047.552.1
Step-1o-turbo-vision 451.8 55.942.041.346.0 48.239.135.547.8 45.856.739.534.6 52.541.945.137.1 59.510.055.957.1
Doubao-seed1.6 154.1 57.743.073.448.4 56.339.151.752.2 46.955.038.735.9 54.843.347.836.6 58.828.055.955.7
Skywork-R1V4-Lite 640.1 38.649.043.634.3 35.827.018.246.9 34.635.829.419.6 42.931.643.429.6 51.08.039.048.6
Open-source Models
Qwen3-VL-8B-Inst 343.1 36.120.028.714.1 37.624.427.325.7 45.840.030.337.3 44.237.238.134.4 49.622.044.130.0
Qwen3-VL-8B-Think 939.7 41.822.041.535.7 36.328.722.720.4 39.035.821.936.4 39.020.936.330.7 42.918.035.622.1
GLM-4.1V-9B-Base 542.6 39.719.036.224.4 36.232.228.531.0 43.042.533.638.6 42.428.436.337.6 51.332.044.132.1
GLM-4.1V-9B-Think 144.9 45.825.036.240.9 42.843.524.854.0 44.836.728.639.1 40.233.539.828.5 51.526.039.027.1
Kimi-VL-A3B-Inst 1039.7 36.125.012.823.5 33.927.824.045.1 36.435.824.435.0 43.828.440.735.5 49.310.039.023.6
Kimi-VL-A3B-Think 1336.0 32.618.034.027.2 31.622.619.827.4 34.625.026.121.8 39.025.143.429.0 42.112.042.427.1
MiMo-VL-7B-SFT 840.2 36.923.030.913.2 39.832.228.937.2 38.121.721.037.3 38.932.131.926.3 48.416.044.123.6
MiMo-VL-7B-RL 740.9 38.221.033.016.9 39.935.730.230.1 38.429.226.937.3 41.234.031.930.1 48.218.047.523.6
MiniCPM-V-4.5 243.9 37.120.019.219.3 44.340.034.333.6 42.636.726.935.0 43.535.838.131.2 52.526.037.327.1
Ovis2.5-9B 442.7 40.720.030.924.9 41.136.533.138.1 39.320.822.745.5 40.924.739.831.2 53.240.047.528.6
LLaVA-NeXT-Video 1628.3 32.625.042.623.0 21.525.225.28.0 25.932.518.523.2 26.323.726.623.1 36.620.035.629.3
LLaVA-OneVis-7B 642.3 37.422.028.727.2 34.828.725.248.7 43.230.828.650.5 45.624.737.237.1 49.620.030.529.3
InternVL2.5-8B 1238.7 36.116.045.714.1 31.717.418.644.3 37.234.233.633.2 40.424.240.737.6 48.210.050.925.0
Skywork-Reward 1433.2 36.85.041.528.2 34.927.024.436.3 22.82.521.021.8 32.721.923.919.4 44.628.035.619.3
Molmo-7B-D 1138.7 33.317.025.530.5 33.531.320.730.1 36.828.334.532.3 41.826.533.628.0 48.226.044.133.6
Phi-4-Multi 1532.0 31.823.046.816.4 29.033.917.840.7 27.311.716.825.0 32.028.415.024.7 42.018.032.217.1
Spatial Models
Spatial-SSRL-4B 139.8 39.222.035.115.0 31.231.326.521.2 41.630.031.147.3 37.830.235.424.7 48.034.049.227.1
SpaceOm-4B 238.9 38.625.040.423.5 34.333.923.148.7 37.135.019.333.2 37.926.536.334.9 47.28.045.835.0
SpaceThinker-3B 338.7 35.821.038.319.3 34.225.229.855.8 35.625.029.430.9 40.529.833.636.0 48.518.033.933.6
Fine-Tuning Results (CityBot)
Qwen3-VL-2B (base) 930.4 26.430.010.022.7 23.425.012.033.3 37.150.041.731.8 25.413.616.726.3 36.720.050.028.6
CityBot-2B (CoT) 460.2 61.540.070.059.1 62.848.356.083.3 60.175.041.745.5 50.931.838.331.6 67.460.050.057.1
CityBot-2B (w/o CoT) 655.8 58.240.050.068.2 50.041.728.075.0 57.366.741.745.5 46.118.233.342.1 67.440.050.060.0
Qwen3-VL-4B (base) 836.6 38.520.060.040.9 27.741.728.012.5 37.850.025.036.4 39.227.341.715.8 38.840.033.328.6
CityBot-4B (CoT) 261.0 67.050.070.072.7 59.650.048.066.7 58.166.741.750.0 54.927.341.768.4 67.480.050.071.4
CityBot-4B (w/o CoT) 360.4 62.634.350.068.2 53.233.328.075.0 58.066.741.745.5 59.831.841.752.6 69.440.083.364.3
Qwen3-VL-8B (base) 737.1 40.720.060.045.5 26.68.316.058.3 42.066.733.331.8 38.222.741.726.3 35.740.050.057.1
CityBot-8B (CoT) 161.4 64.850.070.077.3 62.841.752.091.7 58.075.050.054.6 52.940.950.036.8 64.860.066.771.4
CityBot-8B (w/o CoT) 557.8 58.240.050.068.2 54.350.032.083.3 57.375.033.345.5 53.931.825.052.6 65.320.066.750.0

Deep Analysis

Task Correlation Analysis

Task Correlation

We observe generally substantial correlations across the five CvSI categories. Notably, Mental Reconstruction (MR) and Perspective Taking (PT) exhibit the highest inter-dimension correlation (r=0.536), suggesting a shared reliance on underlying cognitive mechanisms. Metric estimation tasks show negligible correlation with others, indicating they constitute a distinct capability.

Human-AI Difficulty Gap

There is an extremely low correlation (R²=0.010) between human accuracy and VLM performance. Tasks found difficult by VLMs do not necessarily pose a challenge for humans, and vice versa. This divergence confirms that CityCube captures unique spatial challenges that are non-trivial for current model architectures, despite being intuitive for humans.

Human-AI Correlation

Citation

@misc{xu2026citycubebenchmarkingcrossviewspatial,
    title={CityCube: Benchmarking Cross-view Spatial Reasoning on Vision-Language Models in Urban Environments}, 
    author={Haotian Xu and Yue Hu and Zhengqiu Zhu and Chen Gao and Ziyou Wang and Junreng Rao and Wenhao Lu and Weishi Li and Quanjun Yin and Yong Li},
    year={2026},
    eprint={2601.14339},
    archivePrefix={arXiv},
    primaryClass={cs.CV},
    url={https://arxiv.org/abs/2601.14339}, 
}